| The Patient Protection and Affordable Care Act (PPACA), often referred to as Obamacare, was signed by President Obama on Mar. 23, 2010, and on Oct. 1, 2013, the Obamacare health insurance exchanges were opened to the public.
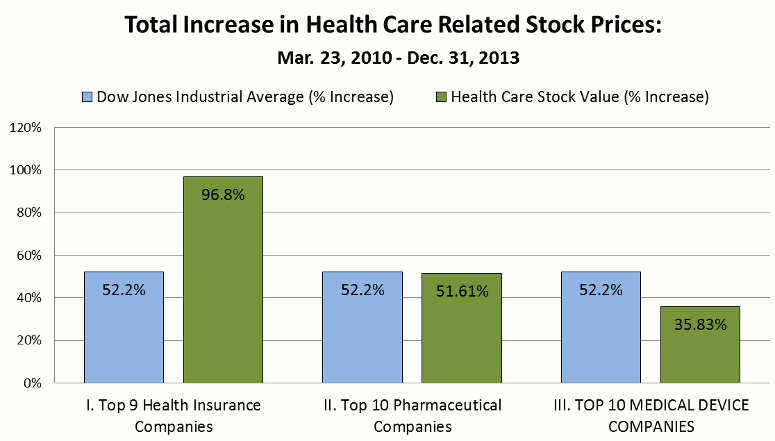
The three graphs below show the Dow Jones Industrial Average and the stock prices of the largest health insurance companies, pharmaceutical companies, and medical device companies, on Mar. 23, 2010, Sep. 30, 2013, and on Dec. 31, 2013. The stock price increase for each of the three categories of health care stocks are then compared with the increase in the Dow Jones for the same periods (Mar. 23, 2010 – Sep. 30, 2013) and (Mar. 23, 2010 – Dec. 31, 2013). |
| TOTAL % INCREASE IN STOCK VALUE Mar. 23, 2010 – Dec. 31, 2013 |
| I. | TOP 9* LARGEST PUBLICLY TRADED US HEALTH INSURANCE COMPANIES | 96.8% |
| II. | TOP 10 LARGEST PUBLICLY TRADED US PHARMACEUTICAL COMPANIES | 51.6% |
| III. | TOP 10 LARGEST PUBLICLY TRADED US MEDICAL DEVICE COMPANIES | 35.8% |
| DOW JONES INDUSTRIAL AVERAGE % INCREASE | 52.2% |
 |
| I. | TOP 9* LARGEST PUBLICLY TRADED US HEALTH INSURANCE COMPANIES (ranked in order of total revenue) |
| Day Obamacare Was Signed into Law | Day Before Health Insurance Marketplace Opened | 3 Years and 8 Months after Obamacare Became Law | |||||
| Company | Ticker Symbol | Stock Price: Mar. 23, 2010 |
Stock Price: Sep. 30, 2013 |
% Increase (3/23/10-9/30/13) |
Stock Price: Dec. 31, 2013 |
% Increase (3/23/10-12/31/13) |
|
| 1. | UnitedHealth Group | UNH (NYSE) | 33.16 | 71.61 | 115.96% | 75.3 | 127.08% |
| 2. | WellPoint | WLP (NYSE) | 63.61 | 83.61 | 31.44% | 92.39 | 45.24% |
| 3. | Humana | HUM (NYSE) | 49.02 | 93.33 | 90.39% | 103.22 | 110.57% |
| 4. | Aetna | AET (NYSE) | 34.99 | 64.02 | 82.97% | 68.59 | 96.03% |
| 5. | Cigna | CI (NYSE) | 36.94 | 76.86 | 108.07% | 87.48 | 136.82% |
| 6. | Health Net | HNT (NYSE) | 25.26 | 31.7 | 25.49% | 29.67 | 17.46% |
| 7. | WellCare Health Plans | WCG (NYSE) | 31.23 | 68.13 | 118.16% | 70.42 | 125.49% |
| 8. | Centene | CNC (NYSE) | 24.24 | 63.96 | 163.86% | 58.95 | 143.19% |
| 9. | Molina Healthcare | MOH (NYSE) | 16.94 | 35.6 | 110.15% | 34.75 | 105.13% |
| Stock Price Totals and % Increase: | 315.39 | 588.82 | 86.7% | 620.77 | 96.8% | ||
| Dow Jones Average and % Increase: | 10,888.83 | 15,129.67 | 38.95% | 16,576.66 | 52.2% | ||
| * The sixth largest health insurance company, Coventry Health Care (CVH), was acquired by Aetna in 2013. We excluded them from our comparison because they are no longer traded on the NYSE, and we could not compare how Obamacare may have impacted their stock price. | |||||||
| Sources: – CNN Money, “FORTUNE 500: Our Annual Ranking of America’s Largest Corporations [Health Care: Insurance and Managed Care – 2012],” money.cnn.com (accessed Nov. 11, 2013) – Yahoo.com, “Yahoo Finance,” finance.yahoo.com (accessed Jan. 16, 2014) |
|||||||
| II. | TOP 10 LARGEST PUBLICLY TRADED US PHARMACEUTICAL COMPANIES (ranked in order of total revenue) |
| Day Obamacare Was Signed into Law | Day Before Health Insurance Marketplace Opened | 3 Years and 8 Months after Obamacare Became Law | |||||
| Company | Ticker Symbol | Stock Price: Mar. 23, 2010 |
Stock Price: Sep. 30, 2013 |
% Increase (3/23/10-9/30/13) |
Stock Price: Dec. 31, 2013 |
% Increase (3/23/10-12/31/13) |
|
| 1. | Pfizer | PFE (NYSE) | 17.54 | 28.72 | 63.74% | 30.63 | 74.63% |
| 2. | Johnson & Johnson | JNJ (NYSE) | 65.36 | 86.69 | 32.63% | 91.59 | 40.13% |
| 3. | Merk | MRK (NYSE) | 38.50 | 47.61 | 23.66% | 50.05 | 29.99% |
| 4. | Abbott | ABT (NYSE) | 54.34 | 33.19 | – 38.92% | 38.33 | -29.46% |
| 5. | Eli Lilly | LLY (NYSE) | 36.62 | 50.33 | 37.44% | 51.00 | 39.27% |
| 6. | Bristol-Myers Squibb | BMY (NYSE) | 26.79 | 46.28 | 72.75% | 53.15 | 98.39% |
| 7. | Amgen | AMGN (NasdaqGS) | 60.06 | 111.92 | 86.35% | 114.08 | 89.94% |
| 8. | Gilead Sciences | GILD (NasdaqGS) | 47.76 | 62.87 | 31.64% | 75.10 | 57.24% |
| 9. | Mylan | MYL (NasdaqGS) | 22.92 | 38.17 | 66.54% | 43.40 | 89.35% |
| 10. | Allergan | AGN (NYSE) | 64.39 | 90.45 | 40.47% | 111.08 | 75.51% |
| Stock Price Totals and % Increase: | 434.28 | 596.23 | 37.29% | 658.41 | 51.61% | ||
| Dow Jones Average: | 10,888.83 | 15,129.67 | 38.95% | 16,576.66 | 52.2% | ||
| Sources: – CNN Money, “FORTUNE 500: Our Annual Ranking of America’s Largest Corporations [Pharmaceuticals – 2012],” money.cnn.com (accessed Nov. 11, 2013) – Yahoo.com, “Yahoo Finance,” finance.yahoo.com (accessed Jan. 16, 2014) |
|||||||
| III. | TOP 10 LARGEST PUBLICLY TRADED US MEDICAL DEVICE COMPANIES (ranked in order of total sales) |
| Day Obamacare Was Signed into Law | Day Before Health Insurance Marketplace Opened | 3 Years and 8 Months after Obamacare Became Law | |||||
| Company | Ticker Symbol | Stock Price: Mar. 23, 2010 |
Stock Price: Sep. 30, 2013 |
% Increase (3/23/10-9/30/13) |
Stock Price: Dec. 31, 2013 |
% Increase (3/23/10-12/31/13) |
|
| 1. | Johnson & Johnson | JNJ (NYSE) | 65.36 | 86.69 | 32.63% | 91.59 | 40.13% |
| 2. | GE Healthcare | GE (NYSE) | 18.33 | 23.89 | 30.33% | 28.03 | 52.92% |
| 3. | Siemens Healthcare | SI (NYSE) | 97.72 | 120.51 | 23.32% | 138.51 | 42.49% |
| 4. | Medtronic | MDT (NYSE) | 45.72 | 53.25 | 16.47% | 57.39 | 25.52% |
| 5. | Baxter International | BAX (NYSE) | 59.37 | 65.69 | 10.65% | 69.55 | 17.15% |
| 6. | Covidien | COV (NYSE) | 51.1 | 60.94 | 19.23% | 68.10 | 33.27% |
| 7. | Abbott Labs | ABT (NYSE) | 54.34 | 33.19 | -38.92% | 38.33 | -29.46% |
| 8. | Cardinal Health | CAH (NYSE) | 36.26 | 52.13 | 43.77% | 66.81 | 84.25% |
| 9. | Stryker | SYK (NYSE) | 56.21 | 67.59 | 20.25% | 75.14 | 33.68% |
| 10. | Danaher | DHR (NYSE) | 38.78 | 69.32 | 78.75% | 77.20 | 99.07% |
| Stock Price Totals and % Increase: | 523.19 | 633.2 | 21.03% | 710.65 | 35.83% | ||
| Dow Jones Average: | 10,888.83 | 15,129.67 | 38.95% | 16,576.66 | 52.2% | ||
| Sources: – Medical Product Outsourcing, “The Medical Device Top 30,” mpo-mag.com, July 31, 2013 – Yahoo.com, “Yahoo Finance,” finance.yahoo.com (accessed Jan. 16, 2014) |
|||||||


